Small Country, Big Data: Challenges of Classifying Swiss Land Usage with Low-Resolution Images
Urban growth monitoring is essential for sustainable planning, especially in environmentally conscious regions like Switzerland. In this project, we explored how freely available Sentinel-2 satellite data can be used to analyze land cover dynamics in Zurich over an eight-year period—from 2017 to 2025.
Our Process
Our approach avoids supervised deep learning models, which require high-resolution or labeled datasets that aren’t available for Switzerland. Instead, we made use a rule-based classification pipeline based on spectral analysis of Sentinel-2 bands.
The image below shows a schematic process of the image acquisition and processing

Acquiring the Images
We applied an Area of Interest (AOI) segmentation to maintain the maximum spatial resolution independent from the size of the AOI.
Clouds are a significant issue in optical satellite imagery. Although Sentinel Hub provides cloud coverage estimates, we found them to be unreliable.
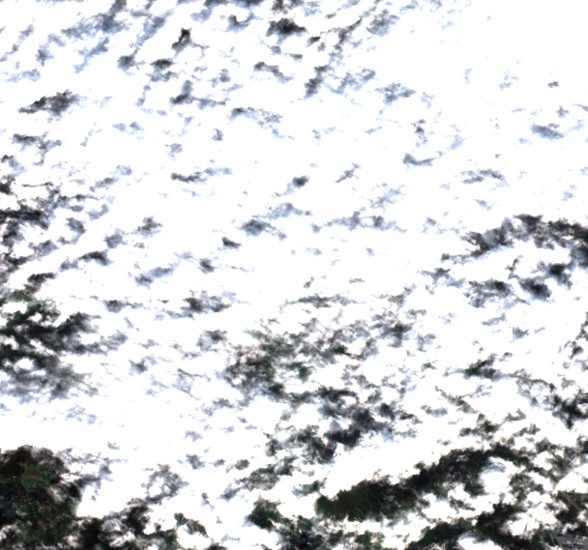
Example case where the Sentinel API reports 18.88% cloud coverage
Therefore we had to calculate the actual coverage and only used images with less than 20 % coverage.
For each valid image, we applied three separate Sentinel Hub evalscripts to generate binary masks for:
- Built-up areas (using NDVI, NBSI, etc.)
- Green spaces (based on NDVI from B08 and B04)
- Water bodies (using NDWI, MNDWI, and SWI)
Each land cover class was encoded with an RGB value.
| Class | Visual Color |
|---|---|
| Built-up | Red |
| Green space | Green |
| Water body | Blue |
| Clouds | White |
| Unclassified | Black |
By combining these masks a composite land cover image was produced, as illustrated in the gif.

7 year evolution in Zurich (raw)
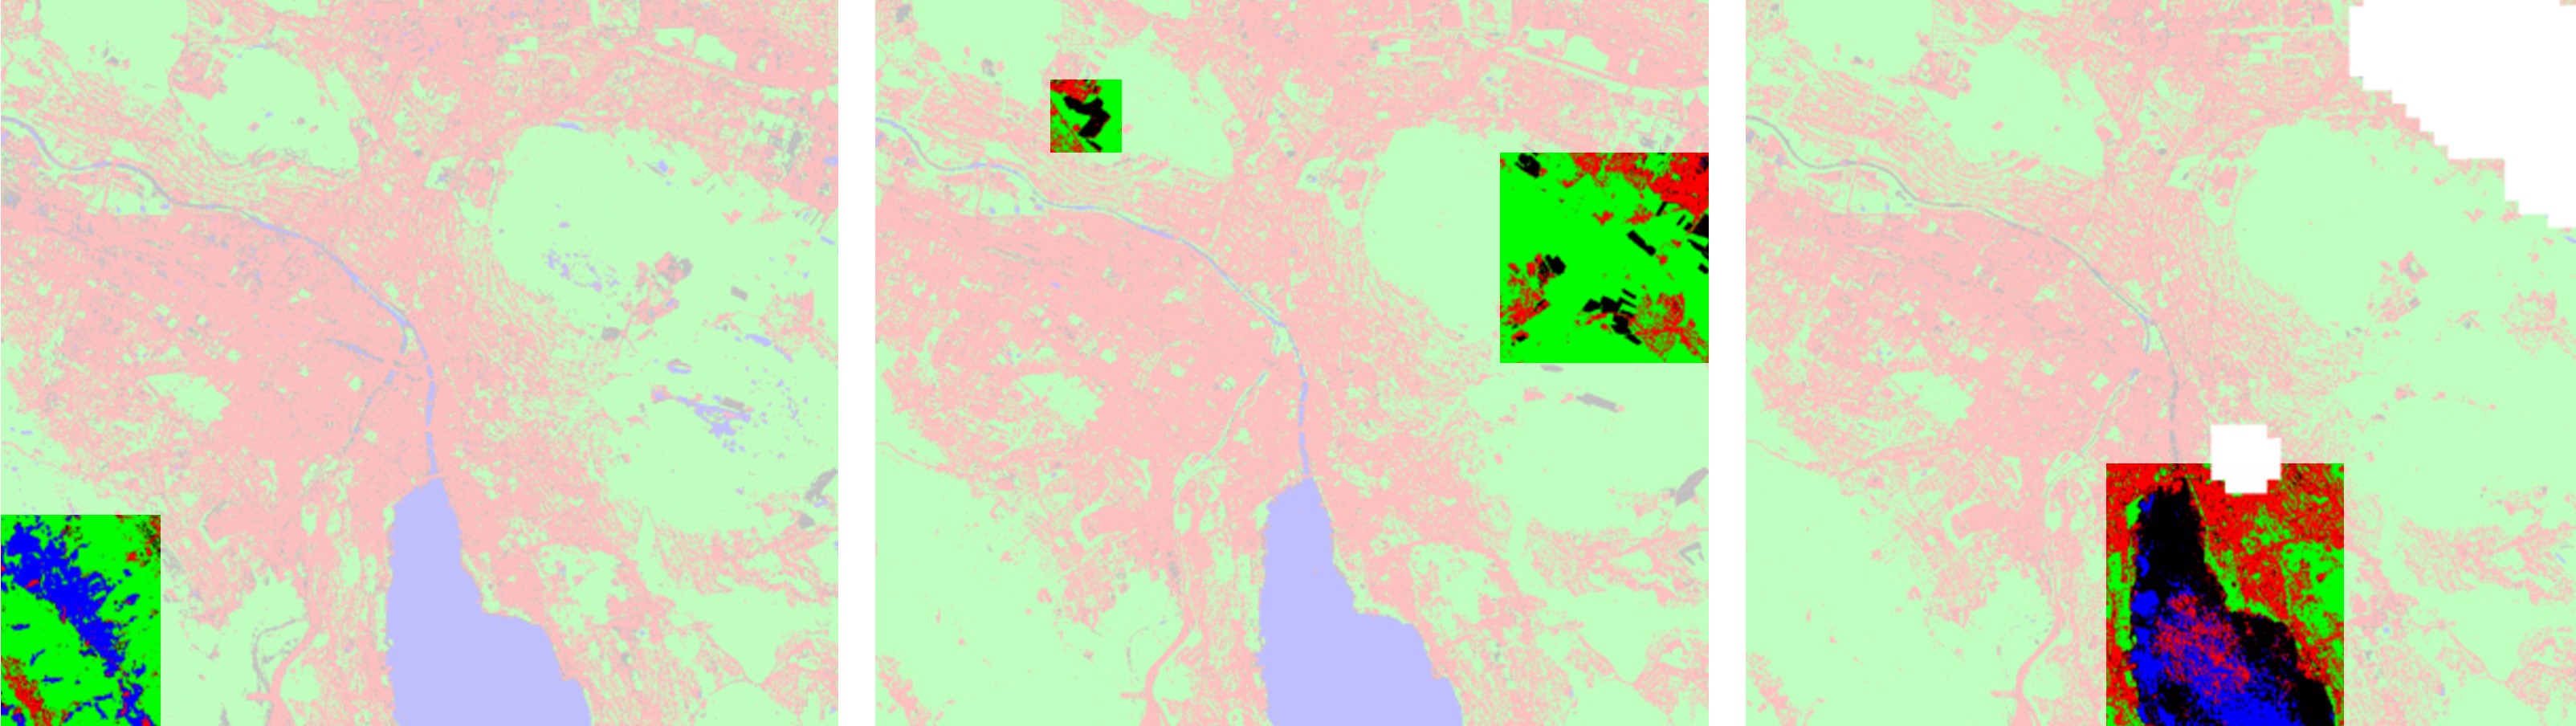
As one can see, it doesn’t look quite right yet. Apart from clouds blocking parts of the image, the most common misclassification cases are shown below.
-
Snow-covered areas cover green space (left)
-
Seasonal variation leads to confusion between green spaces and unclassified areas (center)
-
Built-up structures within Lake Zurich (right)
Solving the Misclassifications
To tackle these issues, we implemented 2 aggregation methods:
Priority aggregation: fills unclassified and cloudy pixels by checking later timestamps, giving precedence to:
built-up > water > green
Temporal aggregation: corrects inconsistencies across time using a majority-vote scheme over five-frame windows to handle misclassifications (e.g. buildings spawning in the lake).
By applying these aggregation methods we achieved a more stable visual representation of the evolution:
7 year evolution in Zurich (with aggregation)
Finally, usable images but…
Now that we had a good data basis, we came across a different problem. Due to our restrictions on cloud coverage and the aggregation of images, we lost a big chunk of data. Over the window of 7 years we originally had 216 images but after removing the cloudy ones and applying our aggregation methods we only had 106 images left. Additionally the timestamps of the leftover images were irregular.
This meant that trying to learn anything meaningful on the evolution of these classes would pose quite difficult..
And it was. Visualized below is the evolution of all classes over the whole time-window.
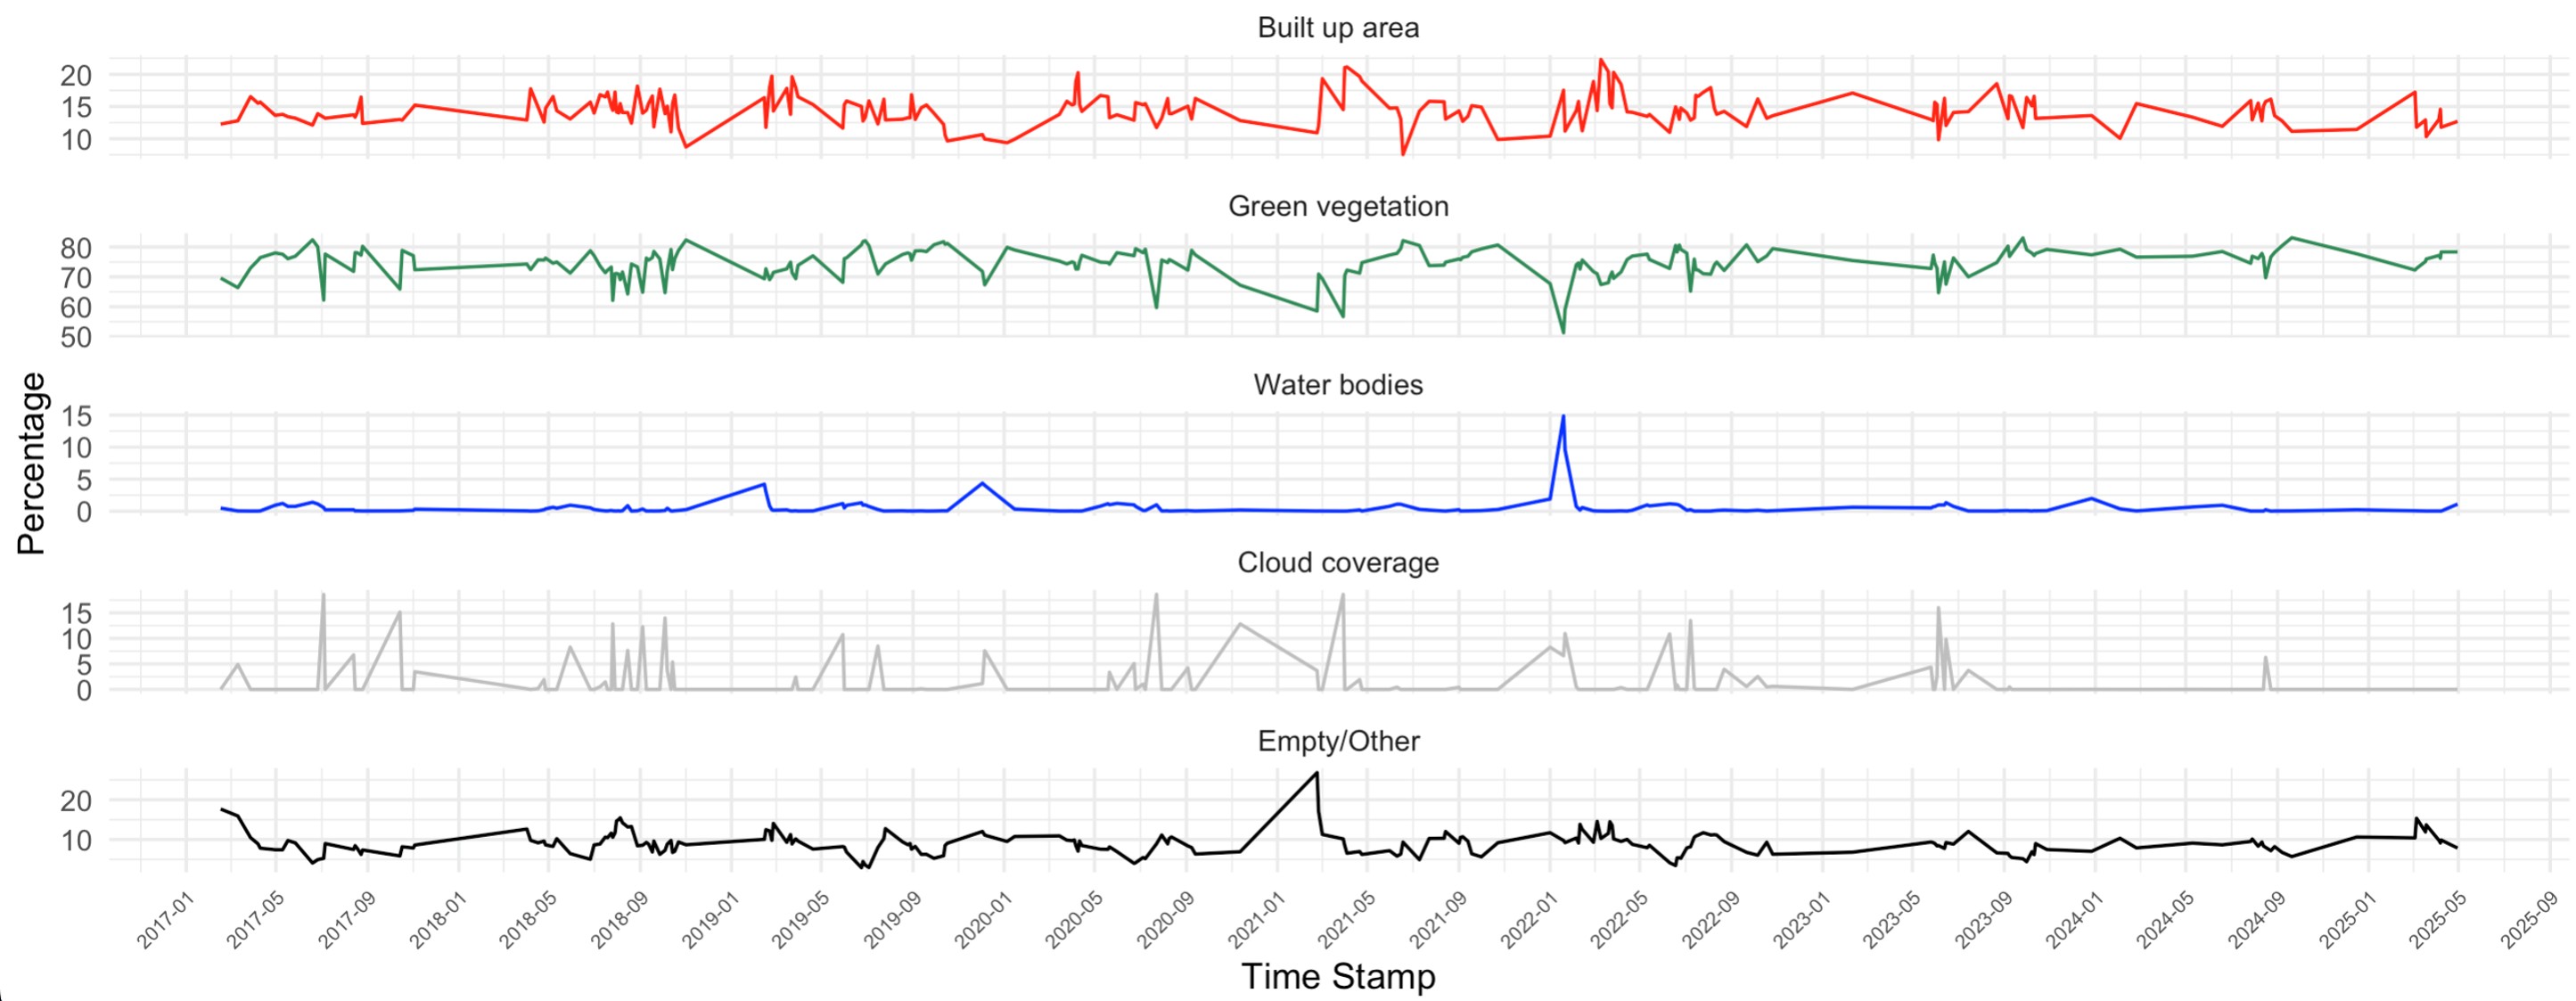
Despite minor seasonal variations and short-term fluctuations, no clear long-term trend such as a steady increase in built-up area or decline in vegetation is evident from the data over this time-period. The Zurich area shows relatively low levels of built-up expansion, suggesting limited recent construction activity as the space within the city is already quite limited.
A reoccurring pattern though, is water,which seems to always peek during the winter months. We found that the reason for this is that snow shows similar reflectance values as water and is therefore also classified as such. This is also mentioned previously in the overview of the most common misclassifications.
Our Takeaways
Our analysis revealed that Zurich has experienced minimal urban expansion between 2017 and 2025, with seasonal and environmental factors being the primary drivers of variability in classification results. In retrospect we probably should have picked a different area for our tests since Zurich is not the busiest city in terms of building activity.
While our approach cannot match the spatial precision of supervised deep learning models trained on high-resolution aerial images, it offers a viable alternative.
Want to know more? Check out our GitHub Repository